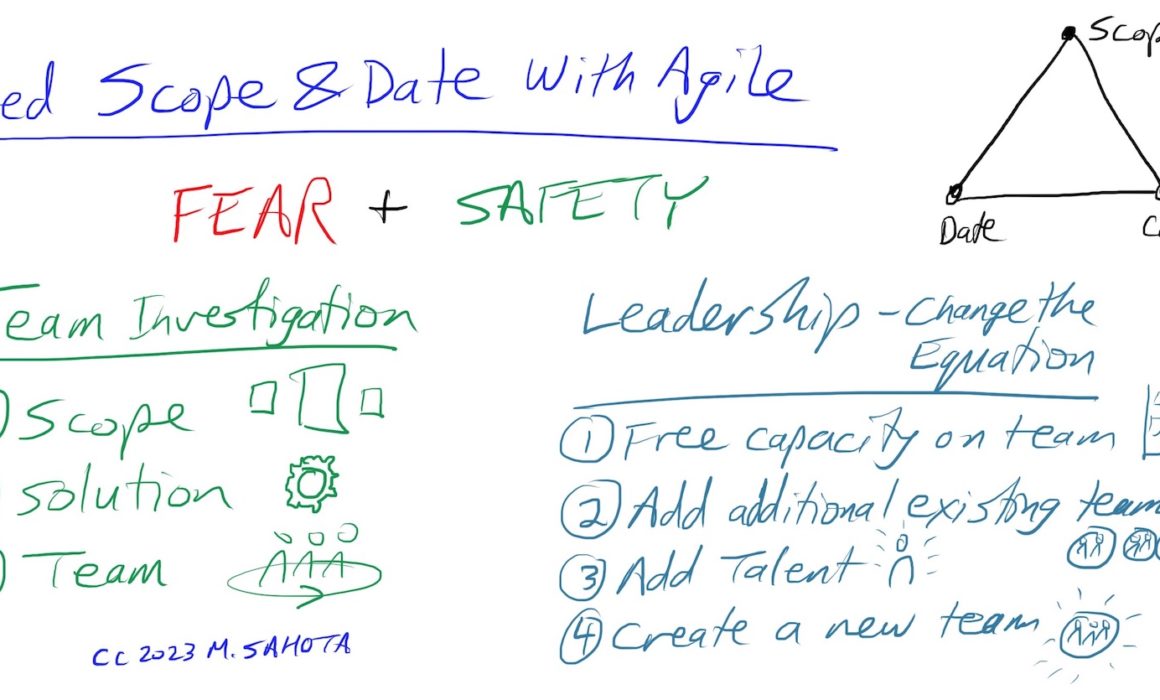
How to Deliver a Fixed Scope, Fixed Date Project with Agile
How to deliver a fixed scope, fixed date project with Agile and work with waterfall teams. Overcome typical Agile assumptions and beliefs.
How to deliver a fixed scope, fixed date project with Agile and work with waterfall teams. Overcome typical Agile assumptions and beliefs.
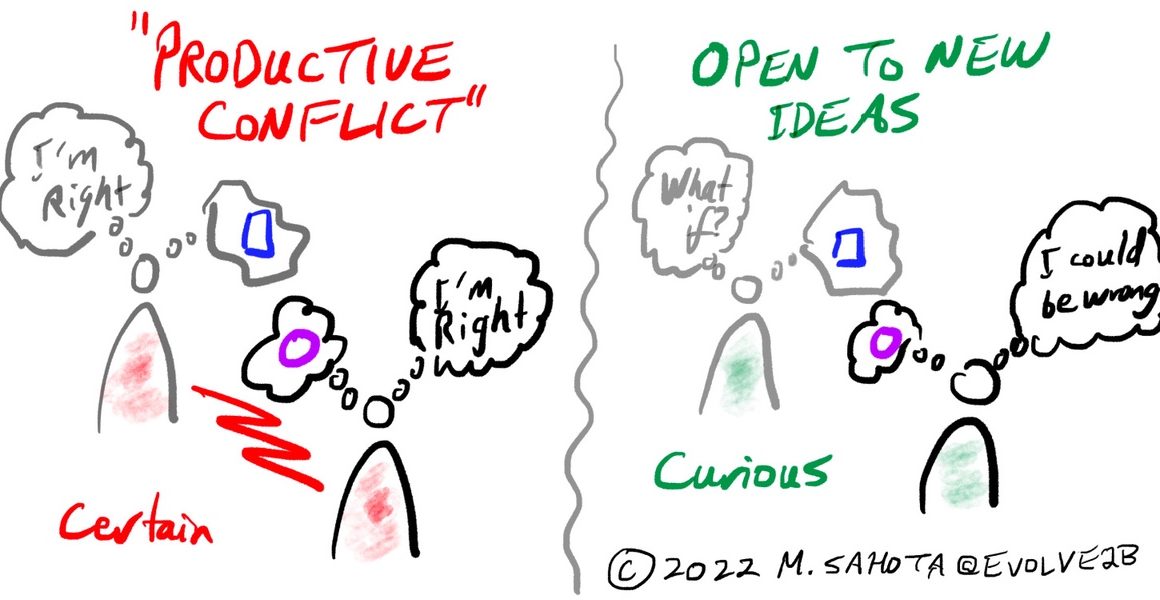
Move beyond productive conflict and develop the skills to work through differing ideas and perspectives and achieve greater organizational success.

A common illusion is that leaders tell people what the process should be, but knowing how to challenge the process can align your organizational goals.
Organizational survival is optional. In a rapidly changing world, the ability to support continuous change unlocks success.

Leadership power is something anyone can have regardless of their role. It’s about the ability to create outcomes with the people around us.

Organizational success, like personal success and achievement, comes in many flavors. There are five dimensions we’ve found to be critical

Your Leadership Brand is how people connect with you as a leader. It determines the relationship you have with the people you work with.

A great leadership profile helps you zero in on the characteristics needed for unlocking success. But what makes a great leadership profile?
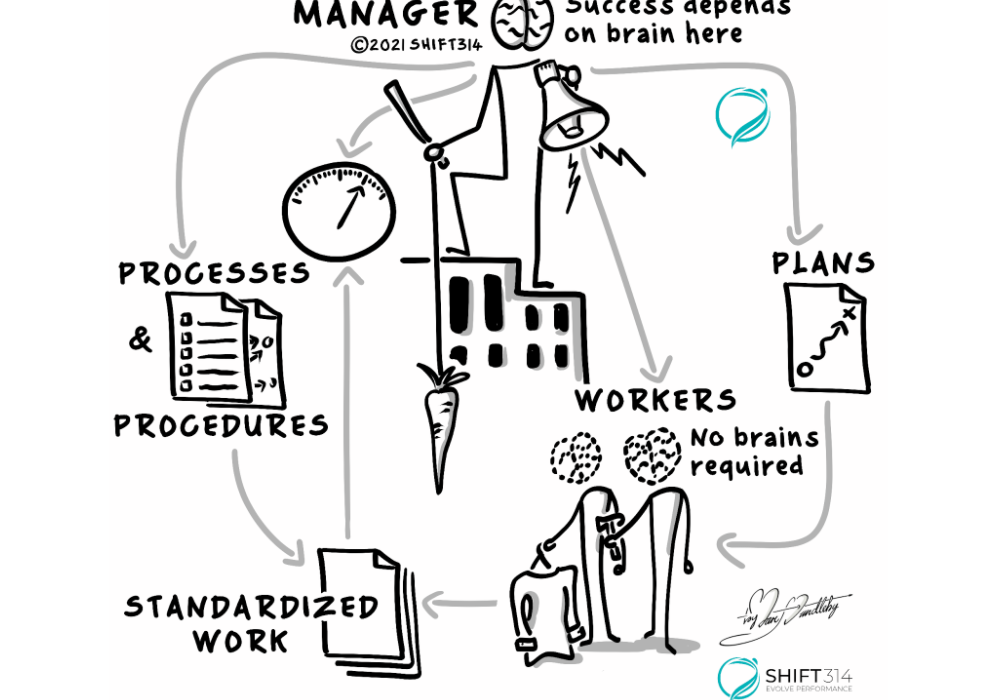
If you are doing anything that resembles traditional management, then there is a huge opportunity to move to a more effective way of managing.

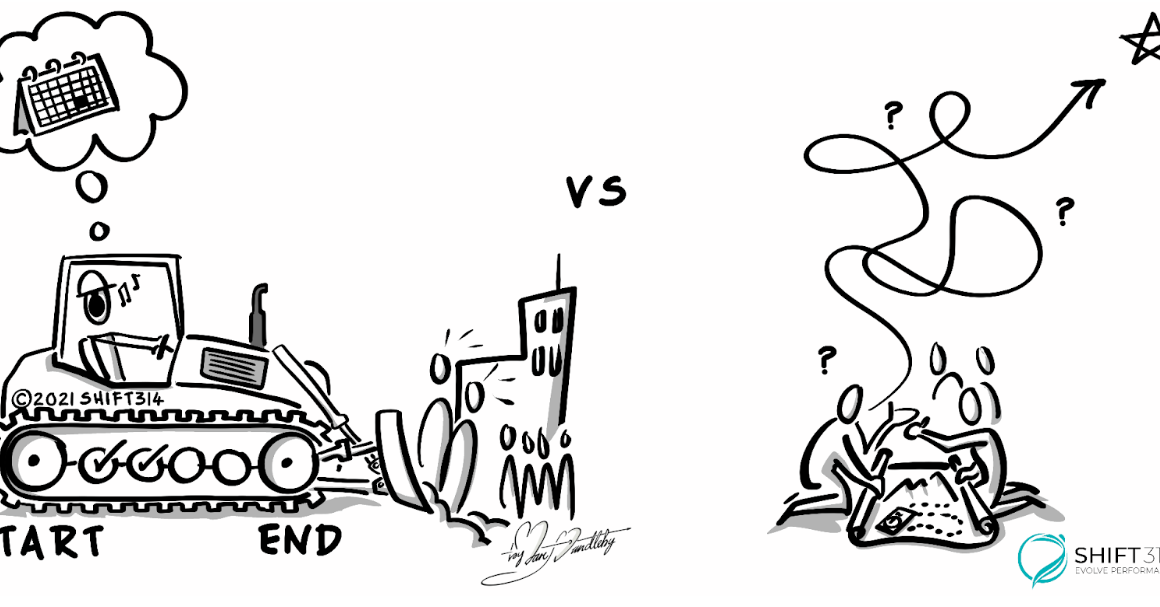
Iterative Development is based on the understanding that with complex work products, it’s not possible to get it right the first time.

In this article, we’ll discuss how to be an effective leader during periods of rapid change, upheaval and crisis such as the COVID pandemic.
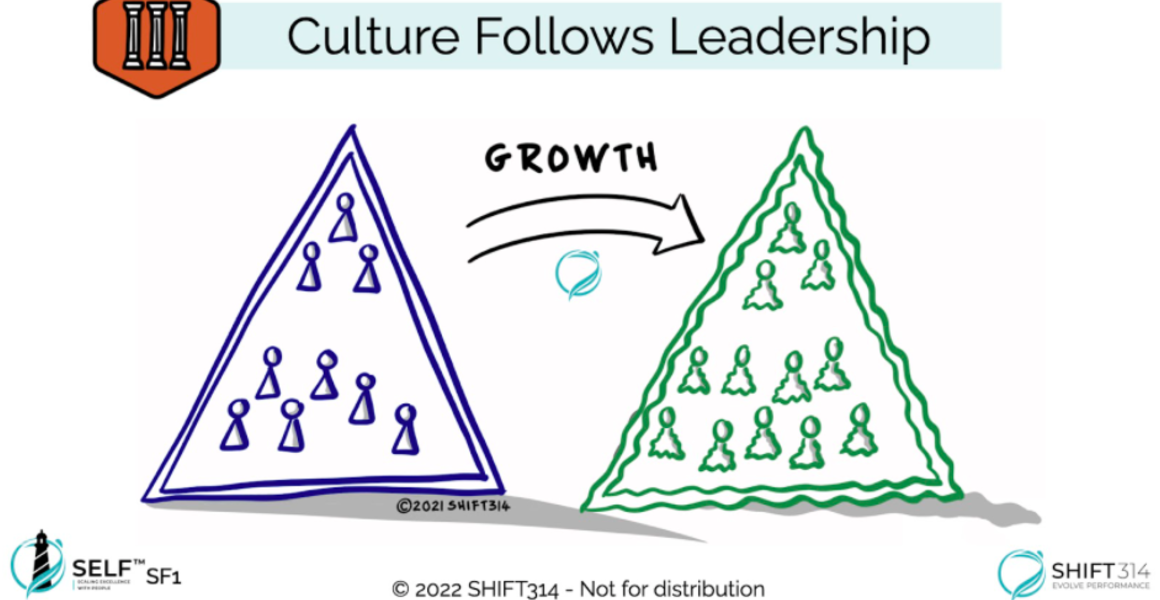
Cultural transformation is a shift from the current cultural state of an organizational system to a more evolved organizational state.